
CIO market update for February 2026
Rob Hogg unpacks August’s CIO Market Update, covering Powell’s dovish Jackson Hole tone, rising long-term bond yields, softer RBA cut prospects, and insights from reporting season.

In this CIO market update, Rob Hogg reviews January’s key market drivers. January was marked by heightened market volatility, driven largely by ongoing uncertainty surrounding US President Trump’s policy pronouncements and geopolitical intentions. Speculation around issues such as Greenland, Iran, and the future leadership of the US Federal Reserve unsettled investors and contributed to a sharp rally in alternatives to the US dollar, particularly precious metals. Despite this uncertainty, global equity markets generally delivered positive returns, with smaller-capitalisation stocks outperforming in both the US and Australia, while Japan benefited from expectations of further policy stimulus. Bond markets reflected shifting monetary policy expectations across major economies, and the Australian dollar strengthened notably amid a weaker US dollar backdrop.
Jump to ⏬: USA | AUS | Outlook
You couldn’t make this stuff up. Another month, another four weeks overwhelmingly impacted by the unpredictability of US President Trump.
Key during January were Trump’s pronouncements about Greenland, but US intentions regarding Iran also added to investor uncertainty as did a lack of clarity regarding who might be the next Chair of the US central bank. The market outcome of this uncertainty was a huge rally in key alternatives to the US dollar – specifically precious metals (gold, silver and platinum) – a rally only punctuated on the last day of the month with the announcement of Trump’s intention to nominate ex-Fed Governor Kevin Warsh for the role as Chair of the US Federal Reserve.
In the midst of the huge rally in metals prices, most global equity markets produced positive returns over the month with better performing markets including US small caps (Russell 2000 index) and Japan (boosted by expectations that the new Prime Minister will implement stimulatory policies if re-elected in upcoming elections). In the Australian market, smaller cap equities performed slightly more positively than broad cap equities – a similar pattern to that exhibited in the US.
Reflecting the expectations for more stimulatory policies in Japan, Japanese 10 year bond yields (JGBs) continued to rise, posting an increase of around 0.2% over the month – JGB yields have now risen from around 0.70% a year ago to 2.25% as at the end of January. US yields also rose over the month, but only very slightly (by 0.03% to 0.07% across the curve). The Australian curve moved by slightly more than the US curve as market participants priced in an ever higher likelihood of a rate increase in February –10-year bond yields rose by 0.05% to 4.81% and Australian 3-year bond yields rose by 0.11%, closing at 4.27%; so causing the yield curve to “bear-flatten” (shorter term yields rising by more than longer term yields).
The release of the local December labour force report (employment up 65,200 and the unemployment rate down by 0.2% to 4.1%) and the December quarter CPI report (trimmed mean up 0.9%) have sealed (in investor’s minds) the near certainty of an RBA rate hike at their early February meeting.
Against the weakening US dollar (USD), the Australian Dollar (AUD) rallied from USD 0.6675 at end December to around USD 0.6960 by end January, after reaching a peak of USD 0.7050 during trading on the last day of the month.
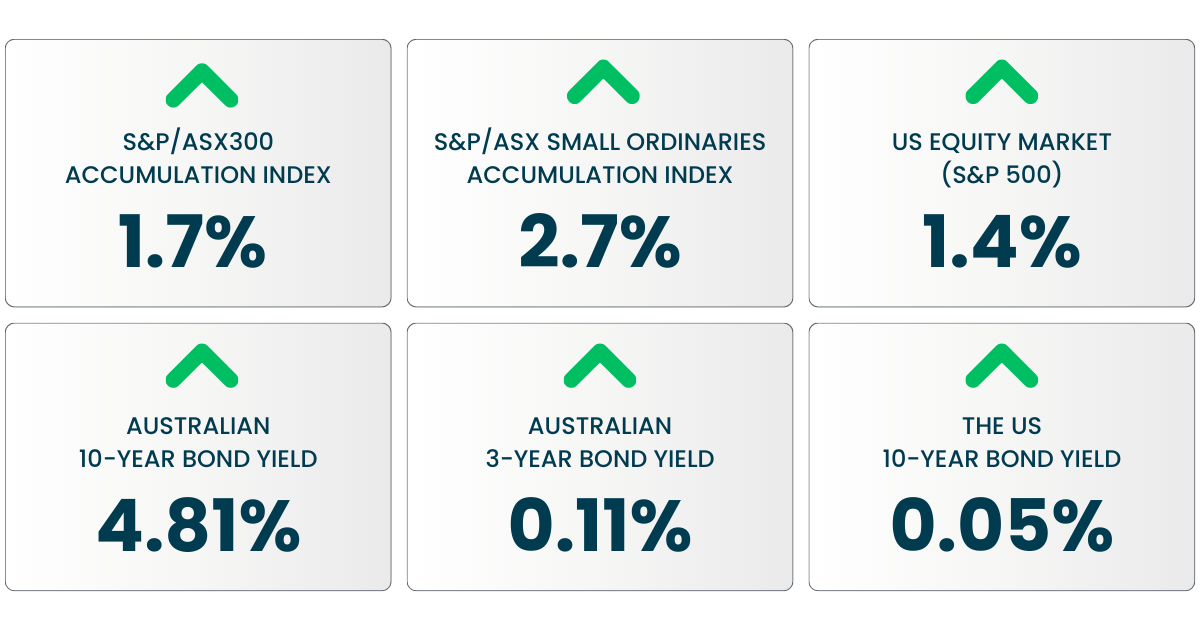
Key market movements over January were as follows:
- S&P/ASX300 Accumulation Index (i.e., including dividends) rose by 1.7%
- S&P/ASX Small Ordinaries (Australian Small Companies) Accumulation Index rose by 2.7%.
- US equity market (S&P 500) rose by +1.4%.
- Australian 10-year bond yields rose by 0.05% to 4.81%.
- Australian 3-year bond yields rose by 0.11%, closing at 4.27% The yield curve “bear-flattened”
- The US 10 bond yield rose by around 0.07%, closing at 4.24%, while 2-year yields rose by just 0.05% to end at 3.53%
- The Australian dollar rose sharply compared with the weakening USD, closing the month around USD 0.6960, up from USD 0.667 at the end December, but peaked at around USD 0.7050 just prior to the announcement of Trump’s Fed Chair nominee.
Key market movements over the month
In this monthly update, we look at:
- Sharp market reaction to the announcement of US President Trump’s nomination for the next Chair of the US central bank (Federal Reserve)
- Market consensus begins 2026 in a very optimistic fashion – beware
- How likely is the continued trend of US disinflation (and Fed rate cuts) expected by the market?
- Continued sell-off in Japanese government bonds
- Australian yield curve continues to “bear-flatten” as a February rate hike gets increasingly priced
- Australian equity market performance also impacted by rising RBA rate hike expectations and the sharp rally in commodity prices (until the last day of the month)
- The upcoming Australian company reporting season
Review of the month’s major developments
• USA •
Sharp market reaction to the announcement of US President Trump’s nomination for the next Chair of the US central bank (Federal Reserve)
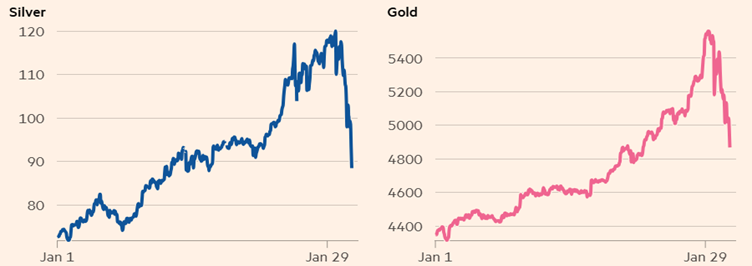
Largely reflecting how much some commodity markets had rallied through January (up until the last day of the month), the announcement that President Trump would be nominating ex-Fed Governor Kevin Warsh as Federal Reserve Chair caused gold and other metals prices to plunge on the last day of January. For all of January, up until this announcement, uncertainty about Trump’s choice as well as acute geopolitical uncertainty — from Venezuela to Greenland to Iran — and a mounting sense of concern over US President Trump’s general policy unpredictability had seemingly caused investors to flee into precious metals in a rush that had sent silver, copper and platinum to record highs during the month. On the announcement of Trump’s nomination of Warsh, gold plummeted as much as 11% while silver — which had risen even more sharply than gold in January — recorded a record one-day fall of 26% and platinum fell 18%. The US dollar was also boosted by the news of the announcement, after having weakened through most of the month.
Investors seem to be increasingly taking a view that gold’s role as an international reserve asset is becoming more important, seemingly at the expense of the USD with investor faith in the USD negatively impacted by the policy uncertainty of the Trump Administration.
Gold and silver prices – month of January 2026 ($ per troy ounce)
Source: LSEG, Financial Times
The announcement of Warsh as the President’s nominee seemed to calm investor unease with Warsh seen as a more orthodox economist than some of the other potential candidates and more likely to be conscious of the inflation risk that could arise should policy rates be lowered in the absence of a compelling macroeconomic reason to do so (i.e.: cutting official rates to 1% as Trump has asked the current Fed Chair to do).
Investors seem to have gained comfort that Warsh, who served as a Fed Governor from February 2006 – March 2011, and who was actively involved in helping to steer the US Federal Reserve during the Global Financial Crisis from 2007-2009 under the Bernanke-led Federal Reserve, will be a better candidate than some others who had been touted. During Warsh’s time as a Governor he was regarded as more hawkish than his Fed colleagues. However, Warsh’s “hawkishness” may have changed. For example, during the recent period of consideration for Fed Chair he argued for lowering interest rates and wrote the Fed needed to rethink inflation “dogma.” (suggesting a more dovish predisposition nowadays).
Warsh has also argued recently that the Fed’s approach to financial regulation imposes excessive compliance costs on banks and disadvantages small and medium-size banks.
The bond market’s reaction to the announcement was indicative of Warsh’s expected policy thrust with the curve steepening as two-year yields fell slightly and 10- and 30-year yields rose – Warsh is seen as likely to trade-off lower policy rates for reduced QE-style buying of longer dated Treasury securities. However, given Trump’s support of Warsh as a candidate for Chair, perhaps investors should not be surprised if Warsh ends up being a bit more dovish (and in line with Trump’s stated positions) than his prior record might suggest.
At the time of the announcement, Senator Tillis, a member of the Senate Banking Committee, reiterated that he will oppose the confirmation of any Fed nominee, including a potential Chair, until the Department of Justice’s investigation into Chair Powell is resolved. Opposition from one Republican member of the committee is enough to stall the nomination if no committee Democrats support it.
Market consensus begins 2026 in a very optimistic fashion – beware
Most years it is extremely useful to begin the year with an understanding of market “consensus” as this can give a guide to how investors are currently positioned and also a sense of what types of news might most surprise investors. This year, according to findings by global investment bank Goldman Sachs (GS), it seems that the consensus view is extremely optimistic.
GS annually host an early January Global Strategy conference for their clients where they survey client sentiment. At their recently concluded conference their client surveys pointed to significant optimism about the investment outlook for 2026:
- Client expectations for the US economy’s growth prospects for 2026 were at a multi-year high with over 80% of surveyed clients expecting US GDP growth at or above consensus (2.1% for 2026), with recession fears nearly vanishing
- There was a strong consensus for monetary easing with most respondents anticipating rate cuts from the Fed (average expectation of 0.70%, or almost three cuts)
- Equity market sentiment was extremely positive with 82% of respondents expecting positive global equity returns in 2026 (the highest ever proportion), with 42% of respondents anticipating double-digit gains (also a record proportion)
In regard to risks, 65% cited geopolitics as the biggest risk for 2026.
How much will US GDP grow in 2026 (annual average)?
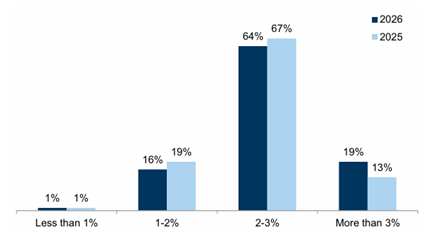
Source: Goldman Sachs – based on respondents at their January Global Strategy conference
Clearly, the vast majority of clients surveyed at the GS conference in early January were extremely optimistic about growth and equity returns for 2026. The strength of positive sentiment is cause to reflect on what the risks to these overwhelmingly positive sentiments might be.
These expectations are, to a significant extent, interdependent – the overwhelming consensus view for the Fed to continue cutting rates in 2026, even as US GDP is expected to surprise on the upside, would likely require continued dis-inflation (positive but easing inflation). Therefore, the outlook for inflation is key to the optimism for 2026 being realised. But, how likely is the disinflation scenario, and what are the risks to this scenario?
How likely is the continued trend of US disinflation (and Fed rate cuts) expected by the market?
The latest US Consumer Price Index (CPI) release revealed that the CPI rose by 2.7% over the year to December, the same annual pace as in November – but a step-down from 3.0% in September (there was no release for October owing to the government shutdown). The measure of “core” inflation similarly eased, with annual core inflation printing at 2.6% in November and December – also a step-down from 3% in September.
Annual percentage change in the US CPI
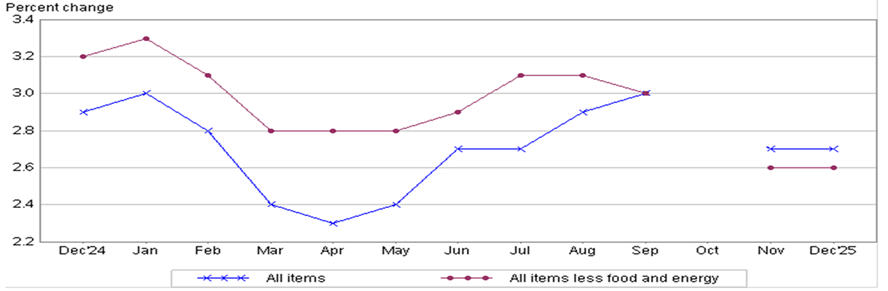
Source: US Bureau of Labor Statistics
Although this pattern suggests an easing in inflation pressures (disinflation), which would potentially support the consensus expectations of further official rate cuts in 2026, underlying measures of inflation are not so clearly pointing to an easing in price pressures as we show below.
To get a better gauge of momentum in underlying inflation we turn to the Federal Reserve Bank of Cleveland’s analysis of “median” and “trimmed mean” inflation measures. Neither of these measures are anywhere near as supportive of the continued disinflation/rate cut scenario.
The December annual readings for these two underlying measures were respectively 3.1% and 3% – both rates of growth that remain well above the Fed’s 2% long term inflation target. But it’s not just the annual change that is important, the momentum in monthly change is also important and, for both of these measures, the pace of monthly growth (at 0.3% for both measures in December) seems inconsistent with the consensus expectation of three rate cuts in 2026.
In the absence of a marked slowdown in the US economy, it will be difficult for the US central bank to cut rates as aggressively as the consensus currently expects, so potentially placing at risk investors’ optimistic expectations for US growth and equity market returns in 2026.
Cleveland Fed’s Inflation Measures
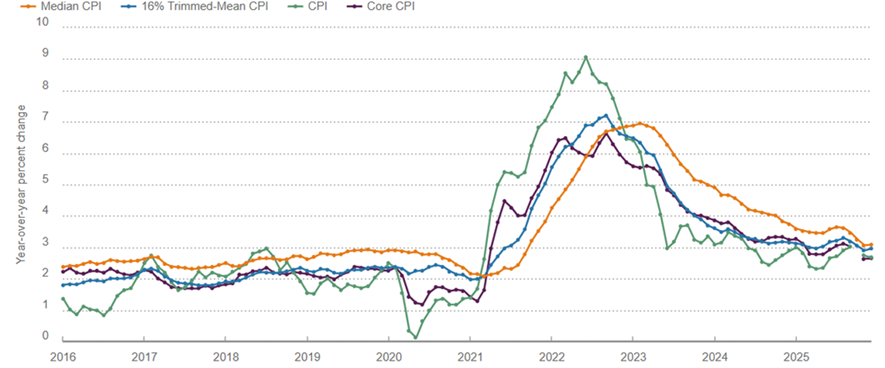
Source: Cleveland Federal Reserve Bank
Continued sell-off in Japanese government bonds
The yield on Japanese government bonds rose sharply in January boosted by several factors including the calling of an early election (with increased fiscal spending a key policy), a two-year temporary tax cut on food announced by the Japanese PM as she announced the early general election, and a weak 20-year bond auction. This sell-off continues a trend that has seen JGB yields rise for the past 18 months which has been driven primarily by higher inflation expectations (as revealed by rising inflation “break-evens” – a measure of bond investors’ inflation expectations.
As JGB yields move higher, the risk of a negative “spill-over” to other global bond markets will increase as Japanese investors find the yield on their home country Japanese government bonds is approaching/higher (after hedging back into JPY) than the yield available on (for them – a Japanese investor) on a foreign developed county sovereign bond.
Japanese 10 Year Government Bond Yield (%)
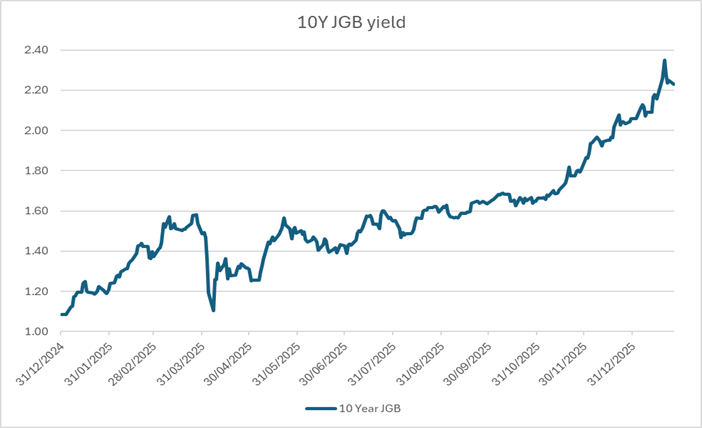
Source: Bloomberg
• AUS •
Australian yield curve continues to “bear-flatten” as a February rate hike gets increasingly priced
Two key economic releases during January – the December reports about the labour force (employment) and consumer prices – contributed to a further bear-flattening in the Australian yield curve as investors increasingly priced an expected rate hike at the RBA’s early February policy meeting (a bear-flattening refers to a period of rising market interest rates, when shorter term yields rise by more than longer term yields)
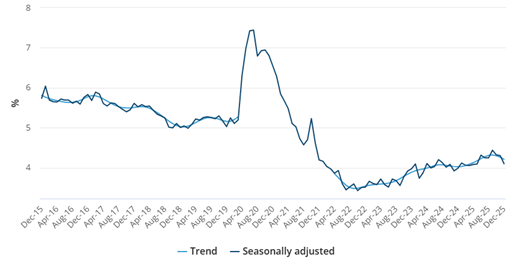
Rate hike expectations were boosted early in the month by news that the number of people employed rose by a higher-than-expected 65,200 in December, pushing the unemployment rate down from 4.3% to 4.1%.
Unemployment rate (%)
Source: ABS
Rate hike expectations peaked on the day before the release of the Consumer Price Index for December (month and quarter), with rate fears easing only very slightly on the day of the actual release of the report (“sell the rumour, buy the fact”).
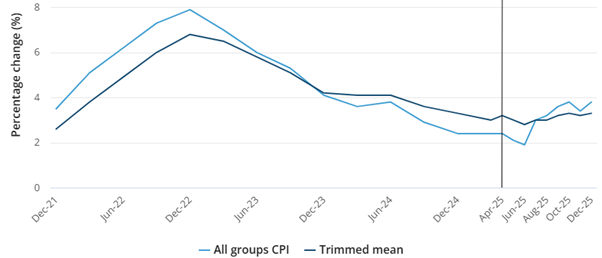
The December quarter release revealed that underlying (“trimmed mean”) inflation rose by 0.9% in the quarter and by 3.4% over the year (up from 3.0% in the September quarter). For the month of December, annual trimmed mean inflation was 3.3%, up from 3.2% over the 12 months to November 2025. The continued buoyancy in this measure definitely puts an RBA rate hike on the table for discussion at the February monetary policy meeting.
All Groups CPI and Trimmed Mean (Annual % Movement)
Source: ABS
Australian equity market performance also impacted by rising RBA rate hike expectations and the sharp rally in commodity prices (until the last day of the month)
Just as rising rate hike expectations caused the domestic yield curve to bear flatten, so these evolving rate hike expectations also impacted the performance of the local share market.
Among the sectors most negatively impacted by changing rate expectations was the Real Estate Investment Trust (REIT) sector – REITs being historically sensitive to changes in market interest rates. Also significantly impacted by rising investor concerns about the potential negative impact of higher interest rates on consumers was the Discretionary Retail sector with the stocks most impacted including Temple and Webster, Harvey Norman, Super Retail and JB Hi Fi.
Driven by factors external to Australia, the Materials sector performed very strongly in January, boosted by rising commodity prices, in particular gold. Gold and Energy companies performed especially strongly over the month – Northern Star, Newmont and Evolution Mining/Paladin Energy, Santos and Whitehaven Coal.
The upcoming reporting season
At the macro level, for much of 2025, the earnings performance and outlook commentary of many companies was positively assisted by the support that easing monetary policy, expansive fiscal spending and moderating inflation provided. However, a very dramatic shift in interest rate expectations – from expected cuts to expected hikes – has now occurred and, with that only occurring very recently, it’s unlikely to have yet had its full impact on consumer spending, and company planning and commentary. The clearest early signs of the impact of this change in the macro environment has been seen quite narrowly so far as some companies, such as those in the consumer discretionary sector, have had to begin higher promotional activity and discounting to stimulate demand and drive sales.
But broadly speaking, Australian equities are heading into the February reporting season with improving earnings momentum, driven by strength in the resources sector, underpinned by a surge in commodity prices and earnings upgrades across the resources sector.
However, while the overall earnings outlook appears positive, cost pressures will likely remain a key theme, particularly for companies with limited pricing power, with rising wages, energy and input costs continuing to challenge margins.
In the technology sector, concerns around returns on AI investment could weigh on sentiment towards the sector – even when disruptive technologies are transformative and the longer trend is very likely extremely positive, initial euphoria usually gives way to a focus on cashflows and return on investment, and its then that share prices can suffer setbacks. What will be interesting during reporting season will be to see how many companies might be able to demonstrate efficiencies from the harnessing of AI to drive lower costs.
As in every reporting season, management commentary is expected to be closely scrutinised, with many companies entering reporting season under new leadership following a period of unusually high CEO turnover over the past six months (Carsales.com, REA Group, Treasury Wine Estates, Endeavour Group, Domino’s Pizza Enterprises, Rio Tinto and South32).
Capital management may prove to be another key differentiator – with the market’s dividend yield sitting at around 3.2%, (below the long-term average), investors are likely to highly prize sensible yield enhancing measures via capital management.
• CIO market update: Outlook •
Our views have changed very little.
We remain cautious about the market outlook, mainly due to the elevated level of global market valuations and the associated extent of market optimism – if the surveyed GS clients noted earlier are indicative of global investor positioning, it seems we have started calendar 2026 with the majority of investors seeing only upside – for growth, for equity earnings and for the extent of US central bank rate cuts. It seems that not all of these upside surprises can co-exist, and that investors are already positioned for a very positive outcome. There is a not unreasonable probability that optimistic investors cannot but be disappointed, a risk accentuated by the current lofty level of market valuations.
We have been relatively more sanguine about prospects in Australia given that the domestic economy has been showing signs of recovery following the RBA rate cuts in calendar 2025. However, the RBA now finds itself with a dilemma – that the very modest growth revival seems to be perpetuating price pressures in the economy, especially home-growth “core-services” prices. How the RBA balance these continued pressures with (or without) a policy response will play a key role in driving equity market performance in 2026.
We remain cautious, but not significantly underweight – we are looking for opportunities to invest in high quality companies that have not kept up with the market. This has been playing out recently with the strong performance of smaller companies, which have for many years lagged their larger counterparts. But there are not just small companies offering good value. There are many bellwether, traditional large cap companies (not tech), that offer good value in an absolute sense.
It is there that we are focusing our attention.
Read all CIO market updates | Follow us on LinkedIn | Back to the top ⏫
Disclaimer:
SG Hiscock & Company (SGH) has prepared this article for general information purposes only. It does not contain investment recommendations nor provide investment advice. Neither SGH nor its related entities, directors or officers guarantee the performance of the Funds. SGH also doesn’t guarantee the repayment of capital or income invested in the Funds. Past performance is not necessarily indicative of future performance. Professional investment advice can help you determine your risk tolerance as well as your need to attain a particular return on your investment. We strongly encourage you to obtain detailed professional advice. We recommend that you read the relevant Product Disclosure Statement and Target Market Determination, if appropriate, in full before making an investment decision.
SGH publishes information on this platform that is, to the best of its knowledge, current at the time of publication. It is not liable for any direct or indirect losses attributable to omissions, outdated, inaccurate, incomplete or deficient information. Investors and their advisers should make their own enquiries before making investment decisions.

Stay in the loop
Get the latest insights and company news direct to your inbox.
SG Hiscock & Company (SGH) has prepared this article for general information purposes only. It does not contain investment recommendations nor provide investment advice. Neither SGH nor its related entities, directors or officers guarantee the performance of the Funds. SGH also doesn’t guarantee the repayment of capital or income invested in the Funds. Past performance is not necessarily indicative of future performance. Professional investment advice can help you determine your risk tolerance as well as your need to attain a particular return on your investment. We strongly encourage you to obtain detailed professional advice. We recommend that you read the relevant Product Disclosure Statement and Target Market Determination, if appropriate, in full before making an investment decision.SGH publishes information on this platform that is, to the best of its knowledge, current at the time of publication. It is not liable for any direct or indirect losses attributable to omissions, outdated, inaccurate, incomplete or deficient information. Investors and their advisers should make their own enquiries before making investment decisions.