
CIO market update for July 2025
Rob Hogg’s CIO market update breaks down July’s major market shifts – from a surprising RBA hold and falling inflation in Australia to a stronger USD and weak US jobs data in early August. Investor sentiment is starting to shift, and so is the policy landscape.

In this CIO market update, Rob Hogg explores the shifting economic landscape in July, from the EU-US tariff deal and resilient (yet softening) US data to easing inflation trends in Australia. He also examines the market’s sharp reaction to August’s surprise US payroll numbers and what they mean for the global outlook.
Jump to ⏬: USA | EU | AUS | Outlook
Over the course of July, key influences on market movements included an EU/US agreement on tariffs, generally continued resilience in US economic data (albeit with a slightly slowing trend), some signs of reacceleration in US inflation (with the central bank on hold), and continued declines in market volatility. Investors slightly reduced the implied likelihood and size of future US rate cuts, which served to boost the US dollar (USD) toward month-end. July is the first month this year that the US dollar has risen.
In Australia, labour market data softened during July while the latest quarterly CPI report showed broad-based continued easing in inflationary pressures, particularly among the key “underlying” measures. This combination of data readings is expected to lay the foundation for a near-certain August rate cut (although the last “cut” that didn’t in fact occur in early July appeared near certain too).
Equity markets rallied during July, with the Nasdaq (+3.7%) performing best amongst the key US (and global) indexes. The US reporting season has proceeded solidly. Australian share markets returned closer to 2.5% over the month.
US bond yields rose over the month, more so at the shorter maturity end as rate cut expectations were trimmed and the yield curve “bear-flattened”. The 2-year yield rose by 0.24% while the 10-year yield rose by 0.16%.
The bear-flattening pattern was also evident in Australia. This was particularly true following the RBA’s “surprise” decision to leave rates unchanged on July 8. Australian 3-year yields rose by 0.16% and 10-year yields increased by 0.10% over the month.
As noted above, in July, the US dollar experienced its first monthly increase in 2025. The trade-weighted DXY index rose 3.3%. The Australian dollar was softer against the USD, slipping to 0.6430 USD/AUD from 0.6580 USD/AUD.
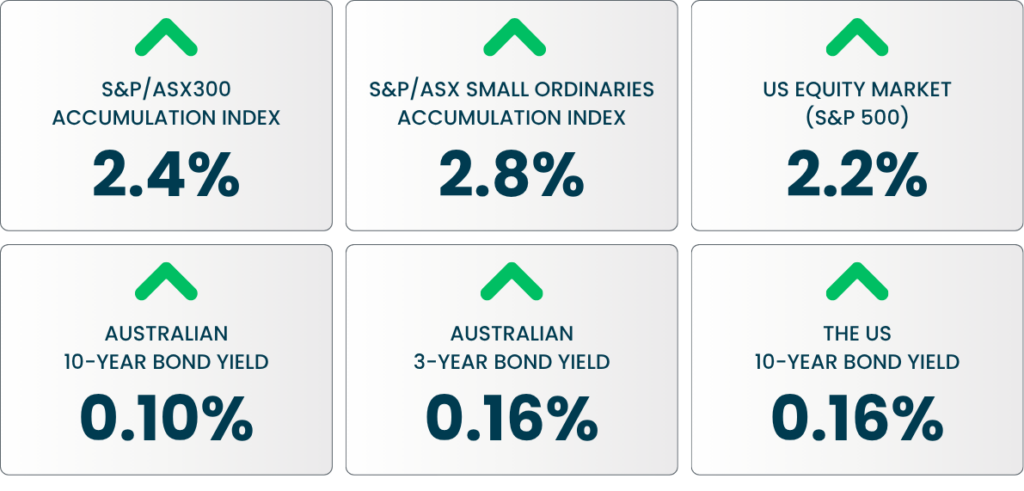
Key market movements over the month were as follows:
- S&P/ASX300 Accumulation Index (i.e., including dividends) rose 2.4%.
- S&P/ASX Small Ordinaries (Australian Small Companies) Accumulation Index rose 2.8%.
- The US equity market (S&P 500) rose 2.2%.
- Australian 10-year bond yield rose by 0.10% to 4.26%.
- Australian 3-year bond yield rose by 0.16%, closing at 3.42%
- The US 10 bond yield rose by around 0.16%, closing at 4.38%
- The Australian dollar moved lower against the strengthening USD, slipping to 0.6430 USD/AUD from 0.6580 USD/AUD.
Key market movements over the month
Post-month-end, August 1 witnessed the release of some shockingly weak US jobs numbers, which caused market sentiment to shift sharply – equities fell. US bonds rallied sharply, with yields falling across the curve, especially at the shorter end (2-year yields fell by 0.275% on the news), as the market dramatically repriced the likelihood of a Fed rate cut in September.
In this monthly update, we look at:
- The shock US July jobs report and the ongoing weakening trend for US manufacturing
- The continued decline in market volatility in July (ahead of the payrolls number)
- In what seems ancient history now, the US central bank left rates unchanged in July
- Chair Powell’s replacement may be known soon
- US inflation trends are making it a tricky environment for the Fed
- US earnings season remains solid
- The GENIUS Act
- The European Union and the US agree on a 15% tariff
- The RBA surprises market participants by leaving official cash rates unchanged
- June quarter CPI – finally, the number the RBA needs to cut rates
CIO market update: July developments in review
Market sentiment, particularly in the US, ended July optimistically. The agreed-upon trade deals and ongoing economic resiliency served as the key drivers. However, the July US payroll report, with its very large revisions to history, has significantly impacted the resiliency narrative.
Market attention will now shift to assessing the likely pace and severity of the current US slowdown, as well as the Fed’s policy response. This policy uncertainty may soon coincide with the perhaps imminent appointment of Fed Chair Powell’s replacement. Fed Governor Kugler’s seat will become vacant and available to fill in a week, well ahead of her January 31, 2026, term.
The economic weakness may be finally becoming more clearly apparent if hard US data turns out to be transitory, given that some semblance of tariff certainty has been reached (no matter how tenuous). But if, in fact, the economy has entered a period of sharper weakening (as the payroll numbers would suggest), the Fed’s job will likely be made more difficult by the signs that inflation is again gaining momentum.
While the reaching of several trade agreements in July seemed to be a source of positive market sentiment, these trade agreements may lack permanency and, with scant detail, are at risk of future change (or challenge, given that Trump may not have the legal ability to make them under his emergency powers). Together, these factors – a faster pace of economic slowing against a background of reviving inflation – leave us even more cautious about the outlook.
Australia: cautious optimism amid global slowdown
In Australia, the economy has yet to show clear signs of recovering following the beginning of the RBA’s rate-cutting cycle. But the June quarter CPI release, in particular, suggests that the RBA will likely cut rates for the third time in early July.
Our view remains that the Australian economy continues to be better placed than many other economies to withstand any global market, tariff and macro turbulence, given:
- Australia’s exports to the US are a very small proportion of the overall economy
- Australia’s starting point of high cash rates means the RBA has significant room to move rates lower if required
- Fiscal support of the economy is likely to continue to have a positive influence
While we increase our level of caution due to the global backdrop, we believe Australia has significant potential to fare better than most other economies and markets during this highly uncertain period.
• USA •
The shock US July jobs report and a weak ISM manufacturing survey
For some months, market analysts have been trying to “square” the sharp weakening in so-called “soft” economic data releases (such as surveys of consumer and corporate confidence) with the continued resilience of “hard” economic data such as investment spending and employment.
However, the July non-farm payroll report has severely shaken the resiliency narrative. It raises questions about whether hard data is finally being impacted, as foretold by the soft data, and whether tariff uncertainty may have contributed to this.
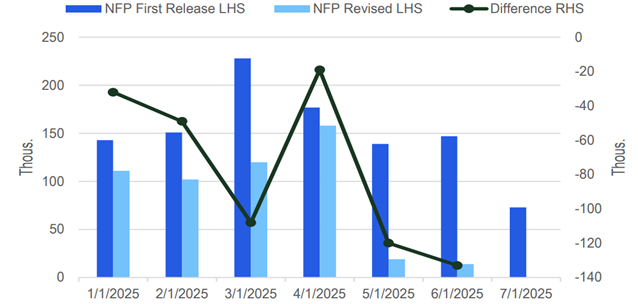
The July employment report was weak across the board. July monthly payroll growth came in below expectations at +73,000. Household employment declined by -260,000. The unemployment rate rose to 4.2% from 4.1%.
However, what was most shocking for investors was the sharp downward revision to payroll growth in April and May, totalling 258,000. This was the largest two-month revision since 1968 outside of recession periods, as shown in the chart below.
These revisions have significantly changed history. They now show a much weaker picture of very low, albeit still positive, job growth in recent months. This has caused market expectations regarding the likelihood and size of Fed rate cuts to move sharply. A rate cut is now seen as extremely likely in September.
Following the weak July print and downward revisions, the three-month trend in employment growth is now just 35,000. This is its lowest level since June 2020.
Monthly revisions to US payroll numbers
Source: Citi
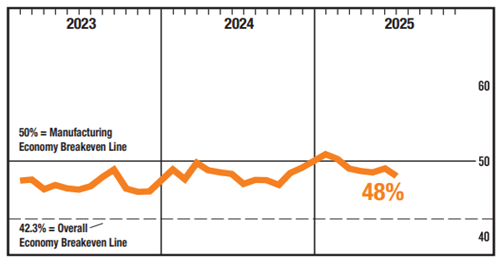
Also released on August 1 was the latest update for the key ISM manufacturing report. This report was also weak. According to this survey, the US manufacturing sector contracted in July for the fifth consecutive month, following two months of expansion and preceded by 26 months of contraction. The manufacturing index fell to 48.0%, one percentage point lower compared to the 49.0% reported in June.
US ISM manufacturing survey
Source: US Institute of Supply Management
Market-based measures of volatility continued to slip in July
As July closed (and ahead of the shock US jobs data), measures of market volatility had been continuing to ease. This trend was likely influenced by a range of factors, including the agreement of several trade deals and continued US economic resiliency (as had been displayed in July).
Consistent with these factors, measures of equity and bond market volatility continued to slip in July:
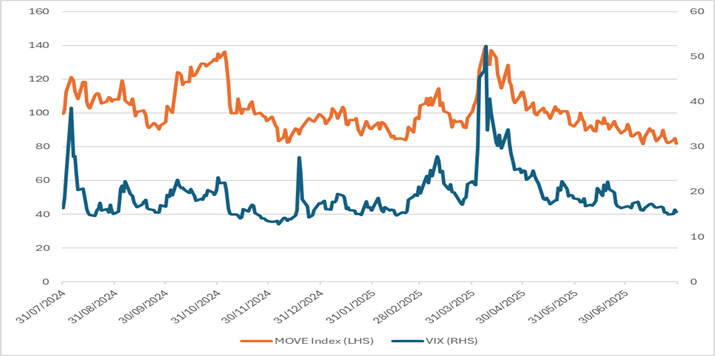
- The VIX Index (measuring the 30-day expected volatility of the US S&P 500 Index) ended the month at 16.7
- The MOVE Index (using the option pricing of US Treasury interest rate swaps) declined by around 12% by month’s end, reaching its lowest level since 2022.
Both of these measures closed in July near the lowest levels they have achieved historically, suggesting that market participants expect little change to current market conditions – a position from which they can only be surprised to the upside in volatility (or the downside in market performance), as indeed they were on August 1.
VIX and MOVE Indexes of expected volatility
Source: Bloomberg
In what seems ancient history now, the US central bank left rates unchanged in July as expected, but also talked down the probability of a rate cut at the next (September) meeting
Markets were not expecting a cut by the Federal Open Market Committee (FOMC) at their July 30 meeting, so they were only mildly disappointed when no cut occurred at the end of the month.
In support of the decision not to cut, Fed Chair Powell said that:
- “monetary policy is modestly restrictive” (which “seems appropriate“); and
- “the economy is not performing as if a restrictive policy is holding it back.
Probably most disappointing for markets was Powell’s lack of conviction in a potential cut in September:
- “I just think we are going to need to see the data, and it can go in many different directions. The inflation data and the employment data… we are going to make a judgment based on all of the data and based on the balance of risks…”.
These statements are now ancient history. The subsequent July jobs report and further weakness in the ISM manufacturing report likely to lead to a cut in September.
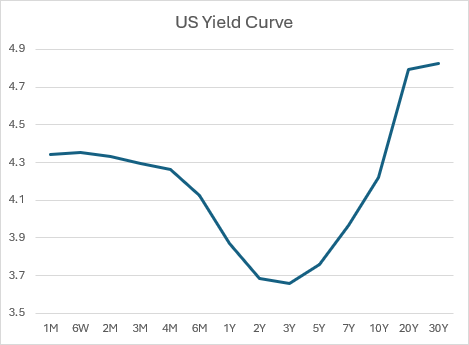
The chart below shows market yields across the yield curve. The inversion at the two- and three-year area of the curve reveals clear expectations of coming rate cuts.
Inversion in the front-end of the Treasury curve
Source: Bloomberg
Chair Powell’s replacement may be known soon
The Federal Reserve Board announced on August 1 that Fed Governor Adriana Kugler will step down from her position as Governor effective August 8. (Her term had been due to continue until January 31, 2026).
Governor Kugler’s seat becoming vacant sooner than expected will likely speed the search for the next Chair. The Administration now has the opportunity to submit a nomination to the Board of Governors imminently. The potentially extended duration of having the heir apparent in place alongside the current Chair could make communications complicated. It may also lead to additional tension on the FOMC (a committee that is already experiencing dissention in voting).
US inflation trends are making it a tricky environment for the Fed, as momentum in the US Consumer Price Index seems to be rising again
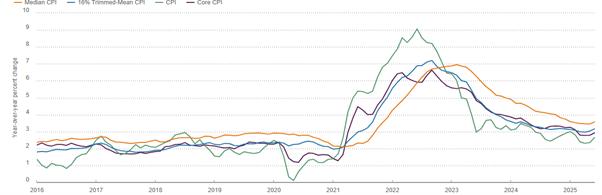
Momentum in US consumer prices has increased in recent months. The CPI increased 0.3% in June, following rises of 0.1% in May and 0.2% in April. In annual terms, the CPI rose by 2.7% in June, up from 2.4% in May and 2.1% in April.
The core CPI rose 0.2% in June, following a 0.1% increase in May. Over the year, the core index has risen by 2.9% to June, up from 2.8% in both May and April.
“Underlying” CPI metrics also seem to be accelerating, as can be seen in the chart below of the trimmed and median CPI measures. An uptick in both the headline and underlying measures is evident in the chart.
Cleveland Fed Inflation metrics
Source: Cleveland Federal Reserve
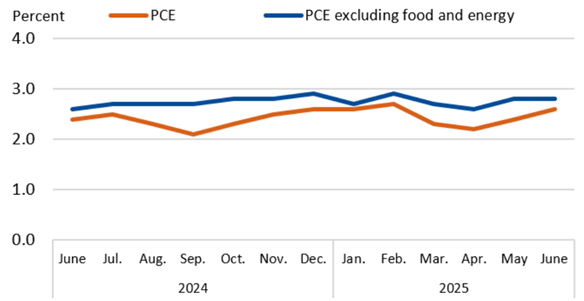
A similar rebounding trend can be seen in a broader-based measure of US inflation – the Private Consumption Expenditure (PCE) price deflator index. From the preceding month, the June PCE price index increased 0.3% as did the “core” measure. This has caused the annual rate of change in both measures to rise, with the PCE price index now at 2.6% and the core index at 2.8%. Measured over a shorter six-month period and annualised, the rate of acceleration is even more noticeable. And this acceleration is occurring before the impact of any pass-through of tariff increases.
Annual change in PCE price indexes
Source: Bureau of Economic Analysis
US earnings season remains solid
As of the end of July, 52.0% of the S&P 500’s market cap had been reported. For the June quarter in total, expectations are for revenues to grow 4.9% and EPS by 7.7%. However, the slowing (albeit still solid) pace of earnings growth from the tech sector is increasingly apparent.
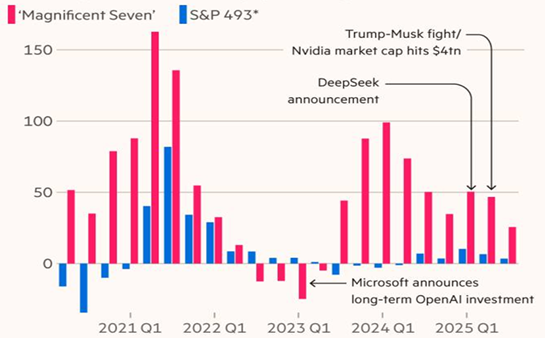
The chart below shows the annual change in quarterly earnings per share for the so-called “Magnificent 7” (Alphabet, Amazon, Apple, Meta, Microsoft, Nvidia, Tesla). It compares this to the remainder of the S&P 500 (the S&P 493).
The Magnificent Seven stocks have driven not only earnings growth but value appreciation for the index. However, they are now showing a decelerating growth pattern. Meanwhile, the “Others”, which struggled to show any growth at all for much of 2023 and 2024, are displaying signs of life.
Annual % change in headline earnings per share (EPS)
Source: Financial Times
Commentary from earnings calls regarding tariffs has so far reflected corporate confidence in the ability to mitigate the impacts of tariffs on profits. The most cited strategies include managing supply chains, increasing prices, and cutting other costs. Of companies discussing the impact of tariffs on their businesses, 27% are now saying that they expect the profit headwind from tariffs to be smaller than their previous estimate.
The GENIUS Act
Around mid-July, Congress passed the GENIUS Act, which regulates tokens known as stablecoins that are pegged to sovereign currencies or other low-risk assets, such as US Treasuries, typically the US dollar. The GENIUS Act requires 100% reserve backing with liquid assets, such as US dollars or short-term Treasuries. It requires issuers to make monthly public disclosures of the composition of their reserves.
The Administration hopes that the Act will generate increased demand for US debt and cement the US dollar’s status as the global reserve currency by requiring stablecoin issuers to back their assets with Treasuries and US dollars.
The heads of Bank of America, Citigroup and JPMorgan Chase have signalled that they would create their own stablecoins once the GENIUS Act is signed into law, according to the Financial Times. This will have very significant implications to be discussed in our latest podcast.
• EU •
European Union and the US come to an agreement around a 15% tariff, but markets sell off following
One of the key positives in July was the July 27 announcement by the US and EU that they’d agreed “on a single 15% tariff rate for the vast majority of EU exports. This rate applies across most sectors, including cars, semiconductors and pharmaceuticals.”
The equity market reaction was subdued. US markets rallied by about 0.5% and European markets by 1% in the aftermath of the announcement. This was likely due mainly to relief that a more damaging tariff escalation could be averted (for now).
However, with no follow-up common statement by both the US and the EU (the announcement being a framework agreement), there seem to be some differing interpretations. These could lead to renewed tensions in the future.
Of note, a panel of US appeals court judges have since questioned (on July 31) whether President Trump has the right to impose tariffs using emergency powers.
Market reaction turns negative as doubts surface
It seems some of this disappointment began to impact markets the day following the deal’s announcement. European equities fell by -0.5%/-1.0% on Monday, July 28, and the Euro/USD exchange rate softened around 1%. Trade-exposed car industry stocks fell by almost 2%
Comments from key European leaders were also negative. German Chancellor Merz stated that the agreement struck with US President Donald Trump the day before would cause “considerable damage” to his country, Europe, and the US itself.
- “Not only will there be a higher inflation rate, but it will also affect transatlantic trade overall.”
- “This result cannot satisfy us…but it was the best result achievable in a given situation.”
France’s Prime Minister François Bayrou said the deal marked a “dark day“, adding that the EU had “resigned itself into submission“.
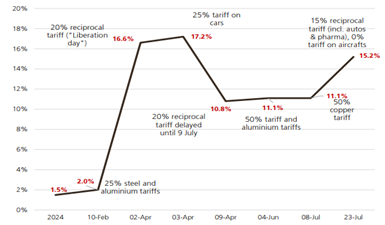
The agreed-upon tariffs still leave the European Union facing far higher tariffs in the future than existed before the April 2 Liberation Day announcement. The new rate sits at around 15% going forward, compared with the approximately 1.5% that was in place before April 2 (according to analysts at UBS).
Weighted average tariff on EU exports to the EU
Source: Haver, World Bank, UBS estimates
By the end of the month, a key European equity index (Euro STOXX 50) had given up all its gains following the initial announcement.
• AUS •
The RBA surprises market participants by leaving official cash rates unchanged at their July 8 meeting
In a (non) announcement that surprised most market participants, the RBA’s newly constituted Monetary Policy Board (MPB) left the key cash rate target unchanged at 3.85%. In contrast, a cut to 3.60% had been widely expected.
Notably, the RBA released the voting pattern of board members, with six members voting for no change in rates, while three voted against (presumably in favour of a cut).
While the RBA Governor, Michele Bullock, reiterated several times in her post-meeting press conference that the RBA’s non-move was merely a question of timing (wanting to get more information before cutting rates). It was not a question of direction (rates still expected to fall). A subtle (but significant) change in the RBA’s market signalling was revealed:
- The Governor made clear that she and other RBA staff will probably not be so active in guiding market expectations (“jaw-boning”) as they may have been in the past. This is because the Policy Board is majority-weighted toward independent members. The meeting outcome, therefore, cannot be known in advance.
No longer will well-placed “leaks” of implied RBA views feature at times when market pricing might be veering away from the RBA’s baseline view. This change will likely lead to greater volatility in markets around interest rate decision days. This is especially true when key data (inflation, employment, and spending) are not all clearly pointing in the same direction, as is currently the case.
Australian labour market conditions continue to soften in June
The unemployment rate rose to 4.3% in June, up from 4.1% in May. The number of people unemployed rose by 33,600, far outstripping the 2000 increase in employment in the month.
At 4.3%, unemployment is at its highest level since November 2021. While this is consistent with a softening labour market, the magnitude of the increase in unemployment in June may overstate this somewhat. Most of the increase in unemployment was driven by people aged 15-24. Unemployment in this group rose from 9.5% to 10.4%, but trends for this cohort tend to be quite volatile.
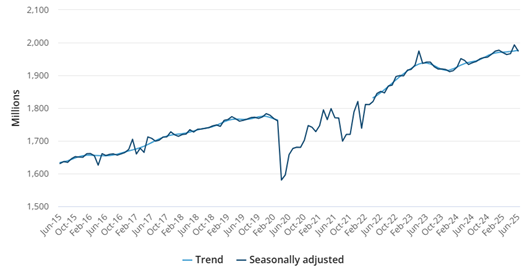
Annual employment growth slowed to 2% in June, down from 3.1% at the end of 2024. Monthly hours worked in all jobs also showed softness in June, with hours worked falling by 0.9%, resulting in annual growth of just 1.8% compared to 3.2% in December.
Monthly hours worked in all jobs
Source: ABS
June quarter Consumer Price Index – finally, the number the RBA needs to cut rates
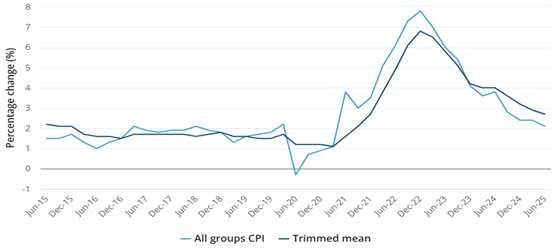
The CPI rose 0.7% in the June 2025 quarter (after 0.9% in the March quarter) and 2.1% annually (was 2.4% in March). This is the lowest annual inflation rate since the March 2021 quarter.
More importantly (from the RBA’s perspective), underlying inflation measures also moderated in the quarter:
- The annual change in the trimmed mean inflation measure was 2.7% in the June quarter. It was down from 2.9% in the March quarter. Meanwhile, the metrics for the median measure were 2.7% in June, down from 3.0% in March.
Cutting the CPI by type (services versus goods) also reveals a deceleration in price growth, with annual goods inflation at 1.1% (down from 1.3%) and annual services inflation at 3.3% (the lowest growth in three years, and down from 3.7%).
Annual change in the All-groups CPI and Trimmed mean (%)
Source: ABS
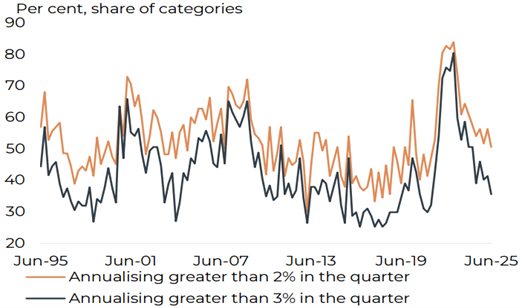
Also encouraging was the diminishing proportion of the total CPI “basket” that is rising by more than 3% annually, as shown in the chart below. This chart shows that a rising proportion of the index is rising by less than 2% and 3%, suggesting that overall prices are now more closely in line with the RBA’s 2% to 3% band.
A diminishing proportion of the CPI basket is rising by more than 3%
Source: Barrenjoey
The upcoming reporting season
August will witness the twice-annual Australian company reporting season. With the RBA having cut rates twice this calendar year, analysts are waiting for signs that domestic conditions are improving. Some expect that companies may be able to speak to an improving trend in their results and outlook statements. Whether companies can point to any potential improvement or are still downgrading will be interesting.
Of interest during August will be whether:
- The nascent rotation back into resource stocks witnessed in July will gain momentum
- Companies will be able to point to signs of recovery in consumer spending
- The scattered industrial company downgrades in recent weeks are typical of trading conditions remaining generally tough
- and (which) bank margins are deteriorating as RBA rate cuts have occurred
• CIO market update: Outlook •
Where to from here?
We are again more cautious about the outlook.
This is particularly due to the evolving policy dilemma in the US. Suppose the latest US jobs report is indicative of an acceleration in the pace of economic weakening, and this is accompanied by an increase in US inflation momentum. In that case, Fed’s policy flexibility will be constrained.
We are relatively more sanguine about prospects in Australia, given the data have coalesced around a path allowing the RBA to cut rates in the coming weeks and months to support the economy, with an ability to speed up rate cuts if required. Fiscal responses also have ample room for implementation, given the relatively healthy state of federal government finances. But this comparatively better background still needs to be considered in the context of the local market’s extended valuation metrics.
Read all CIO market updates | Follow us on LinkedIn | Back to the top ⏫
Disclaimer:
SG Hiscock & Company (SGH) has prepared this article for general information purposes only. It does not contain investment recommendations nor provide investment advice. Neither SGH nor its related entities, directors or officers guarantee the performance of the Funds. SGH also doesn’t guarantee the repayment of capital or income invested in the Funds. Past performance is not necessarily indicative of future performance. Professional investment advice can help you determine your risk tolerance as well as your need to attain a particular return on your investment. We strongly encourage you to obtain detailed professional advice. We recommend that you read the relevant Product Disclosure Statement and Target Market Determination, if appropriate, in full before making an investment decision.
SGH publishes information on this platform that is, to the best of its knowledge, current at the time of publication. It is not liable for any direct or indirect losses attributable to omissions, outdated, inaccurate, incomplete or deficient information. Investors and their advisers should make their own enquiries before making investment decisions.

Stay in the loop
Get the latest insights and company news direct to your inbox.
SG Hiscock & Company (SGH) has prepared this article for general information purposes only. It does not contain investment recommendations nor provide investment advice. Neither SGH nor its related entities, directors or officers guarantee the performance of the Funds. SGH also doesn’t guarantee the repayment of capital or income invested in the Funds. Past performance is not necessarily indicative of future performance. Professional investment advice can help you determine your risk tolerance as well as your need to attain a particular return on your investment. We strongly encourage you to obtain detailed professional advice. We recommend that you read the relevant Product Disclosure Statement and Target Market Determination, if appropriate, in full before making an investment decision.SGH publishes information on this platform that is, to the best of its knowledge, current at the time of publication. It is not liable for any direct or indirect losses attributable to omissions, outdated, inaccurate, incomplete or deficient information. Investors and their advisers should make their own enquiries before making investment decisions.